


NEWS
ESS Manufacturer | Battery Technology | Global Energy Partner
$21/kg Floor Set! U.S. Section 232 Ruling Hits: Global Polysilicon Price Outlook
 Introduction & Executive Summary
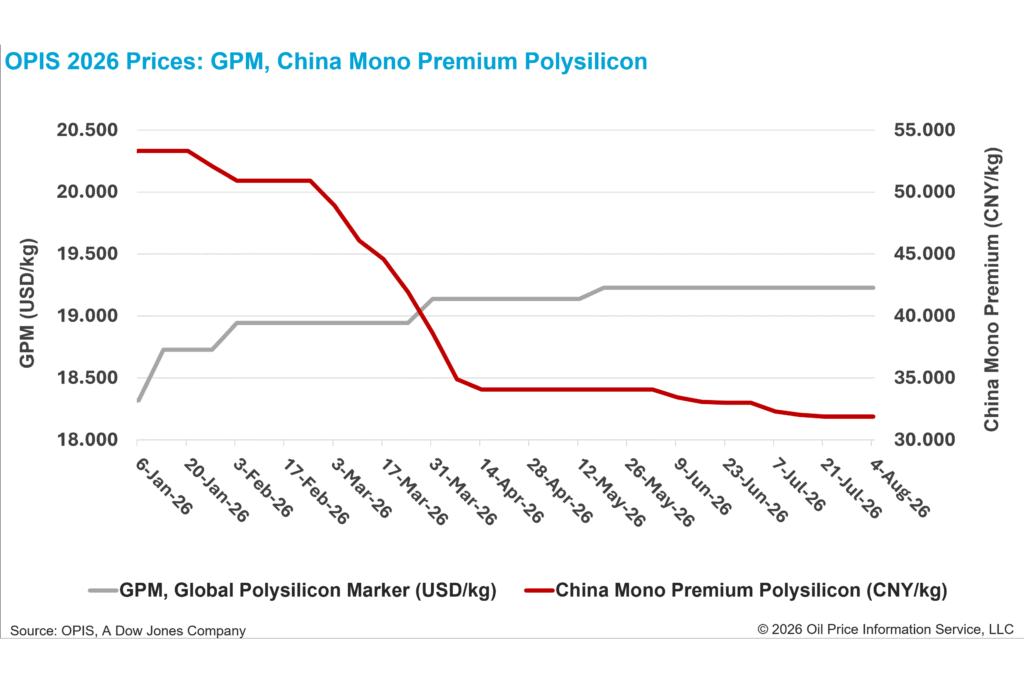
Following a Section 232 investigation initiated by the U.S. Department of Commerce, the United States formally announced its final determination regarding imports of polysilicon and its derivatives on August 6, 2026, establishing a Minimum Import Price (MIP) system and a 15% ad valorem tariff. While this significant trade policy move has had a profound impact on the global clean energy supply chain, market sentiment in the short term has been characterized by a "wait-and-see" approach. According to the latest market data from OPIS (Oil Price Information Service), the Global Polysilicon Marker (GPM) has held steady at $19.227/kg (equivalent to $0.040/W), and the premium for N-type monocrystalline silicon in the Chinese domestic market has remained stable at 31.886 RMB/kg. In the immediate aftermath of the policy's implementation, global polysilicon spot prices have exhibited a distinct, short-term pattern of stability—effectively remaining unresponsive to the news.
Key Takeaways: Policy Baseline vs. Market Realities
|
Metric / Policy Parameter |
Benchmark Value / Official Rate |
Status / Implementation Date |
|
Policy Enforcement Date |
December 4, 2026 |
Effective Date |
|
Polysilicon MIP |
$21.00 / kg |
Minimum Import Price |
|
Ingots & Wafers MIP |
$100.00 / kg |
Minimum Import Price |
|
Solar Cells MIP |
$0.22 / W |
Minimum Import Price |
|
Solar Modules MIP |
$0.38 / W |
Minimum Import Price |
|
Ad Valorem Tariff Rate |
15% |
Additional Duty Rate |
|
Global Polysilicon Marker (GPM) |
$19.227 / kg ($0.040 / W) |
OPIS Spot Price Benchmark |
|
China Monocrystalline Premium |
RMB 31.886 / kg (RMB 0.067 / W) |
OPIS Spot Price Benchmark |
Event Details
According to the final rules issued by the U.S. Department of Commerce under Section 232, effective December 4, 2026, all polysilicon and its downstream derivatives imported into the United States must strictly adhere to a tiered Minimum Import Price (MIP) system; additionally, a 15% *ad valorem* tariff will be imposed on products falling under designated HTS codes. Importers are required to submit a compliance certification upon clearing customs with U.S. Customs and Border Protection (CBP); if the entered value falls below the MIP threshold, a specific tariff equivalent to the shortfall must be paid.
|
Product Category |
Minimum Import Price (MIP) Floor |
Ad Valorem Tariff Rate |
Enforcement Date |
|
Polysilicon |
$21.00 / kg |
15% |
December 4, 2026 |
|
Ingots & Wafers |
$100.00 / kg |
15% |
December 4, 2026 |
|
Solar Cells |
$0.22 / W |
15% |
December 4, 2026 |
|
Solar Modules |
$0.38 / W |
15% |
December 4, 2026 |
2. Analysis of Overseas Manufacturers and Utilization Rates
Currently, the monthly production capacity for non-Chinese polysilicon remains at approximately 8,000 metric tons; only two overseas polysilicon plants are operating at full capacity, and the supply chain faces significant barriers to scaling up. Against this backdrop, a major overseas manufacturer announced in its Q2 earnings report the launch of an expansion plan to drastically increase its wafer production capacity from 2.7 GW to 11.5 GW between Q2 2026 and 2029. Furthermore, by signing new long-term agreements (LTAs) with U.S. clients, the company has secured 100% volume commitments for both its existing annual polysilicon capacity of 35,000 metric tons and its planned capacity expansions for 2028–2029, aiming to leverage favorable policies to solidify the price premiums associated with these long-term contracts.
3. Supply-Demand Mismatch in the Chinese Domestic Market and Administrative Intervention
In stark contrast to the aggressive LTA signings overseas, the Chinese domestic market is mired in a crisis of severe oversupply and a pullback in demand. Data regarding this supply-demand mismatch indicates that, according to the National Energy Administration (NEA), China’s newly installed photovoltaic (PV) capacity in the first half of 2026 was 72.07 GW—a sharp year-on-year decline of 66.0%. Conversely, statistics from the China Nonferrous Metals Industry Association (YSJA) show that domestic polysilicon production in July rose by 13.1% month-on-month to 105,100 metric tons, with August production projected to increase by another 6.6%, resulting in a serious fundamental imbalance.
Administrative regulatory intervention: On July 31, the State Administration for Market Regulation (SAMR) convened a meeting with key enterprises regarding price compliance and promoted the "General Principles for Cost Accounting Models in the PV Industry," aiming to curb disorderly, low-price competition through standardized cost-accounting practices.
Divergence between futures and spot markets: Boosted by expectations of policy compliance, polysilicon futures rebounded by 5.75% in a single day on August 3, reaching 38.030 yuan/kg. In contrast, spot market buyers remained extremely cautious due to sluggish installation demand, illustrating a classic structural divergence where futures reflect market sentiment while the spot market is constrained by fundamentals.

Industry Impact & Unique Insights
1. Failure of Cross-Border "Origin-Laundering" Strategies; Barriers Shift Upstream
Historically, the photovoltaic manufacturing sector often utilized third countries—such as those in Southeast Asia or the Middle East—as transshipment and processing hubs to bypass Antidumping and Countervailing Duties (AD/CVD) through final assembly. However, the recent Section 232 ruling establishes a "look-through" regulatory framework covering the entire value chain. With the full implementation of a tiered Minimum Import Price (MIP) system—ranging from polysilicon ($21/kg) and wafers ($100/kg) to cells ($0.22/W) and modules ($0.38/W)—alongside a 15% tariff, the previous strategy of avoiding taxes via simple downstream assembly has been effectively blocked. U.S. Customs and Border Protection (CBP) will strictly enforce entry certification mechanisms, requiring proof of supply chain traceability across the entire chain, from upstream silicon melting to downstream modules. Compliance-based traceability has shifted from being a competitive advantage to an absolute prerequisite for entering the U.S. solar market.
2. "Political Scarcity" of Overseas Capacity and Risks to Long-Term Agreement (LTA) Fulfillment
The non-Chinese polysilicon sector currently exhibits a distinct structural paradox: while overseas manufacturers aggressively expand long-term agreements (LTAs) to lock in orders, the existing downstream manufacturing capacity outside China—approximately 4 GW per month—has begun to outpace actual end-market demand. This so-called "scarcity" of overseas polysilicon is, in essence, an artificial political scarcity driven by trade policy constraints, rather than a genuine technological or capacity gap. If downstream module prices are driven to high levels by expensive polysilicon LTAs, the Internal Rate of Return (IRR) for utility-scale projects will suffer; consequently, these high-priced LTAs may face significant risks regarding fulfillment and potential default in the future.
3. The "Double-Edged Sword" Effect of Domestic Cost Regulation on Market-Driven Clearing
The State Administration for Market Regulation has introduced "General Principles for Cost Accounting Models in the Photovoltaic Industry," aiming to establish clear cost-accounting standards that curb cutthroat price competition—specifically, pricing below cash costs. However, from the perspective of market dynamics, this policy acts as a double-edged sword. Domestic spot prices (31–32 RMB/kg) have already breached the cash costs of most producers, and the industry has effectively entered a phase of intense, market-driven capacity rationalization. Artificially establishing a price floor through administrative regulation or industry self-discipline could inadvertently provide a lifeline to high-cost, outdated capacity; this would prolong the cycle of eliminating excess capacity and slow down the industry's overall process of bottoming out.
Market Trends and Future Outlook
1. Evolution of Global Polysilicon Prices: A "Dual-Track System" and "L-Shaped Bottom"
Driven by trade barriers and disparities in regional supply-demand structures, the global polysilicon pricing system will increasingly undergo structural divergence:
Evolution of Overseas Markets: As the effective date of December 4, 2026, approaches, spot prices outside China will gradually anchor to the $21/kg Minimum Import Price (MIP) floor. Overseas spot benchmarks—exemplified by the Global Polysilicon Marker (GPM)—will decouple from domestic Chinese prices, establishing a sustained and significant "trade premium." The sustainability of this high-premium range will depend directly on the U.S. solar market's tolerance for the increased module costs associated with achieving grid parity.
Evolution of the Domestic Chinese Market: The domestic market remains constrained by harsh fundamentals, characterized by upstream overcapacity and a decline in new downstream installations (down 66.0% year-on-year in the first half of the year). Although administrative guidelines on cost-accounting standards have been issued, sentiment-driven rebounds in the futures market are unlikely to translate into a sustained, sharp surge in spot prices. Domestic spot prices are expected to remain in a prolonged "L-shaped" consolidation pattern near the cash cost level (31–35 RMB/kg).
2. Business Model Shift: From "Cost-Performance Priority" to "Compliance Traceability + Supply Chain Price Locking"
Over the next 2–3 years, the competitive landscape of the global solar supply chain will undergo a fundamental restructuring:
Shift in Core Competitive Barriers: Cost reduction will no longer be the sole lever for profitability. Leading enterprises that possess forensic traceability certification and have secured price-locking agreements across the ingot-cell-module value chain will command pricing power in high-margin export markets, capturing profit premiums derived from politically driven scarcity.
Accelerated Market Divergence: Secondary production capacity—lacking a complete, compliant traceability chain or relying excessively on transshipment and assembly—will lose access to high-end overseas markets. These players will be forced back into the domestic Chinese market and low-barrier, low-price regions, becoming trapped in a "red ocean" of cutthroat, loss-making price competition.
Conclusion & Actionable Guidance
The Minimum Import Price (MIP) system and the 15% ad valorem tariff established under the U.S. Section 232 ruling, combined with China’s domestic implementation of cost-accounting standards, are reshaping the fundamental logic of the global solar supply chain. The global polysilicon market has moved beyond a landscape defined solely by price-driven competition; it has entered a new phase of regional decoupling and structural reorganization, driven by trade policy, supply chain traceability, and geopolitics.
Strategies for Overseas Buyers and Importers: Capitalize on the 120-day grace period. Leverage the transition period leading up to the policy’s effective date of December 4, 2026, to comprehensively review existing procurement contracts, prioritizing an assessment of exemption eligibility for fixed-term contracts signed before August 6, 2026. Conduct supply chain audits. Require Tier-1 suppliers to provide complete, compliant traceability documentation for the ingot-wafer-cell chain to ensure successful certification reviews during U.S. Customs and Border Protection (CBP) clearance and to mitigate the risk of heavy penalties.
Strategies for Domestic Chinese Polysilicon and Downstream Manufacturers: Abandon unrealistic hopes for a price rebound. Acknowledge the reality that the domestic market is bottoming out over the long term due to the dual pressures of overcapacity and slowing installation growth; shift strategic focus entirely from betting on price recovery to meticulous cash cost control. Build an international compliance framework. Accelerate the adoption of ISO-compliant and international-standard ESG certifications, carbon footprint tracking systems, and third-party forensic traceability solutions to lay a compliance foundation for securing market share in premium overseas markets.
8,000 Sold a Week! Australia 500k Battery Boom: ROI Guide
Saudi Arabia Places Major Bet on 1.07 GWh Solar-plus-Storage Deal to Resolve Syria's Grid Crisis
Related Article


contact us
For more questions please


Office Address: 701, Building A, Yonghuayuan Business Building, Baotian 2nd Road, Chentian Community, Xixiang Street, Bao'an District, Shenzhen, Guangdong Province, China
Factory Address 1: Room 701, Building 2, Kegu Industrial Park, Zone B, Jian'an Road, No. 790, Chang'an Town, Dongguan City, Guangdong Province, China
Factory Address 2: Building 7, Phase II Standardized Factory, Innovation Industrial Park, Duji Economic Development Zone, Huaibei City, Anhui Province, China