


NEWS
ESS Manufacturer | Battery Technology | Global Energy Partner
Europe’s solar power share consistently exceeds 20%, with Latvia reaching 49%—where are the opportunities for energy storage exports?

A Historic Turning Point in Europe’s Energy Transition
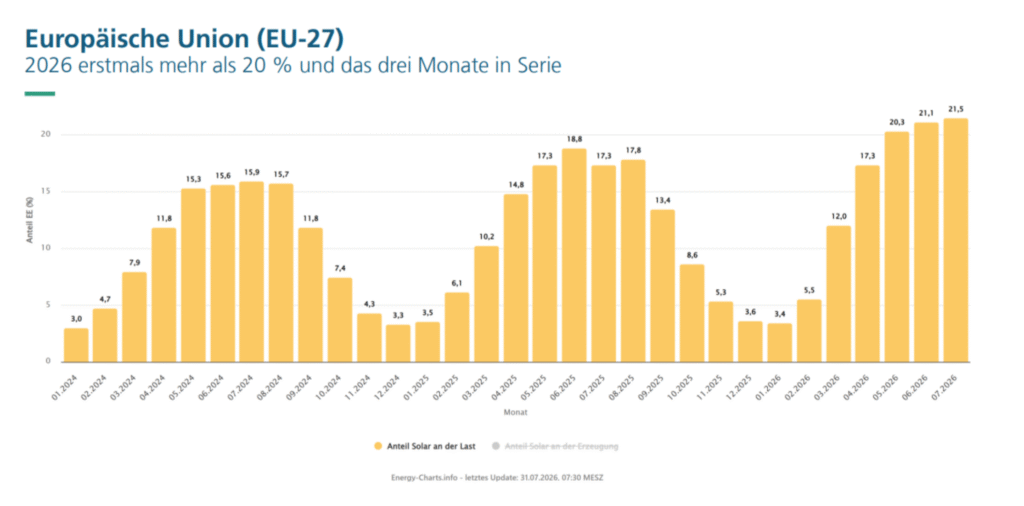
According to the latest monitoring data from Energy-Charts—an authoritative platform managed by the Fraunhofer Institute for Solar Energy Systems (Fraunhofer ISE)—the energy mix of the EU-27 reached a milestone in the summer of 2026: for the first time, solar photovoltaic (PV) generation exceeded the 20% threshold of total EU electricity demand for three consecutive months.
Driven by favorable solar conditions and the rapid expansion of distributed PV installations in recent years, solar power in Europe is swiftly transitioning from a "supplementary energy source" to a "primary power source." However, beneath this surge in green energy, a widening divide has emerged among European markets: the Baltic states have staged a "dark horse" rise, achieving a share of nearly 50%, while traditional powerhouses like Germany and Spain maintain steady progress; conversely, France and Italy—major hubs for nuclear and fossil fuel power—lag significantly behind the EU average.
For global PV supply chain exporters, energy storage (BESS) investors, and power market analysts, this record-breaking surge in green energy not only signals an acceleration toward the EU’s REPowerEU goals but also heralds the start of a new phase of competition centered on electricity consumption, distribution grid upgrades, and the integration of solar and storage technologies.
I. Key Phenomenon: A Historic Milestone and Distribution Landscape
1. Data Snapshot: Surpassing the 20% "Golden Threshold" for Three Consecutive Months
Data indicates that between May and July 2026, the share of solar photovoltaic (PV) power in the EU’s electricity supply demonstrated robust, step-like growth:
May: Share reached 20.3%
June: Climbed further to 21.1%
July: Hit a historic high of 21.5% (preliminary figures)
Compared to the 17.3%–18.8% range recorded during the same period last year, solar penetration this summer saw an overall increase of more than 3 percentage points. Even allowing for minor adjustments to the late-July figures, the analysis team has confirmed that this record-breaking milestone is firmly established.
2. Tiered Differentiation: Surging "Dark Horses," Steady Performers, and Lagging Major Powers
A review of the performance across European nations reveals a "three-tier" pattern of solar penetration that warrants close study:
Frontrunners ("Dark Horse" Regions): Explosive Growth in the Baltic States
Latvia emerged as the standout "European solar dark horse" in these statistics. In June, solar power met a remarkable 49.0% of the country's electricity demand, placing it at the top of the EU rankings. Latvia’s growth trajectory was exceptionally rapid: surging from 34.9% in April to 40.0% in May and maintaining a high of 38.9% in July—figures that contrast sharply with the 13.7%–18.9% range seen during the same period last year. Its Baltic neighbors, Lithuania (44.7% in June) and Estonia (35.8% in June), also demonstrated astonishing rates of growth in solar penetration. The Main Force (Steady Performers): Central-Eastern and Southern Europe See Upward Consolidation
As Europe's largest electricity consumer, Germany saw its solar power share remain above 30% for three consecutive months for the first time (30.3% in May, 30.4% in June, and 31.6% in July), significantly surpassing the 22.6% recorded in July of the previous year—a figure constrained by weather conditions. Southern Europe’s high-solar-irradiance regions also performed impressively; solar demand shares in Spain and Greece remained consistently above 35% for three months (with Spain peaking at 36.9% in June). Bulgaria followed suit, with its solar share decisively crossing the 30% threshold.
The Lagging Group (A Stark Contrast): Why Do France and Italy Fall Below the EU Average?
In sharp contrast to the rapid growth seen in Central-Eastern and Southern Europe, France and Italy have experienced only a slow climb.
France: Although it hit a record high in July, the solar share stood at just 14.6% (up from 13.6% in June and 12.6% in May). The primary reason is France's heavy reliance on nuclear power for baseload generation, which systematically limits grid capacity available for solar integration.
Italy: After peaking at 19.5% in May, the share fell back to 16.7% in July. Complex permitting processes for distributed solar and aging distribution grid infrastructure have become the main bottlenecks preventing further increases in solar penetration.
3. Comparison Table: Solar Power Share in Key EU Countries
The comparison table below clearly illustrates the solar power supply share and year-on-year changes for key EU countries during the summer of 2026:
|
Country / Region |
May 2026 Share (%) |
June 2026 Share (%) |
July 2026 Share (%) |
YoY Performance & Key Insights |
|
EU-27 Average |
20.3% |
21.1% |
21.5% |
Historical threshold crossed for 3 consecutive months |
|
Latvia |
40.0% |
49.0% |
38.9% |
EU top performer; huge jump from ~15% in 2025 |
|
Lithuania |
- |
44.7% |
- |
Baltic regional market boom |
|
Spain |
>35.0% |
36.9% |
>35.0% |
Stable high penetration in South Europe |
|
Greece |
>35.0% |
>35.0% |
>35.0% |
+7% YoY increase supported by strong solar irradiance |
|
Germany |
30.3% |
30.4% |
31.6% |
Core industrial market maintaining >30% threshold |
|
Bulgaria |
>30.0% |
>30.0% |
>30.0% |
Emerging growth market in South East Europe |
|
Switzerland (Non-EU) |
25.8% |
25.3% |
26.5% |
Cross-border benchmark; broken 25% threshold |
|
Austria |
23.3% |
22.5% |
21.9% |
Beat previous all-time record of 20.3% |
|
Italy |
19.5% |
18.5% |
16.7% |
Below EU average due to grid congestion |
|
France |
12.6% |
13.6% |
14.6% |
Below EU average; baseload heavily dominated by nuclear |
II. Breakdown: Three Key Drivers Behind the Surge in Solar Power Share
Europe’s solar power share surpassing the historic 20% mark is not a coincidence driven by a single factor; rather, it is the result of the combined impact of supply-side capacity expansion, seasonal meteorological advantages, and structural shifts in demand.
1. Supply-Side Surge: The Combined Effect of Distributed PV and Balcony PV. Over the past 18 months (2025–2026), Europe has seen an accelerated rollout of new solar capacity, demonstrating a powerful "supply-side stacking effect." Explosive growth in micro-PV and balcony PV: Policy simplifications—such as Germany’s relaxed regulations regarding grid registration and micro-inverters for plug-in solar/balcony PV—have significantly lowered barriers to entry for consumers. A vast number of residential users are achieving "self-consumption" during peak midday generation hours, drastically reducing their need to purchase electricity from the grid. Grid integration of ground-mounted and distributed systems: Supported by RePowerEU funding and policies, a large volume of commercial rooftop PV and utility-scale ground-mounted PV projects—constructed over the past two years—have entered a phase of concentrated grid integration, establishing a solid foundation for total power generation.
3. Impact of the demand-side baseline: The sluggish recovery of electricity consumption in heavy industry has lowered the "total electricity demand" denominator. When calculating "PV share (%) = PV generation ÷ regional total electricity demand," changes in the denominator constitute a structural factor that cannot be overlooked. Weak industrial power load: Electricity demand in certain European heavy industries has recovered relatively slowly due to global economic cycles and overall energy costs. Base effect amplifies the relative percentage: With a low baseline for total electricity demand, the robust growth in absolute PV generation (the numerator) is mathematically amplified, directly boosting solar power's relative share within the overall electricity mix.
III. Pain Points Revealed: "Negative Electricity Prices" and Grid Crises Beyond 20% Penetration
Industry Discussion: Do Higher Solar Shares Lead to Lower Returns?
1. The "Duck Curve" and Negative Electricity Prices
The rapid rise in the share of solar power has caused countries like Germany and Spain to face extreme "Duck Curve" dynamics during June and July. During the midday peak of solar generation, electricity supply outstrips demand, frequently driving market prices to extreme negative levels—hitting the -€50/MWh floor. This surplus of green electricity directly causes a sharp decline in both the realized prices (capture prices) and overall revenues for solar power plants.
2. Grid Congestion and the Risk of Solar Curtailment
Beyond price collapses, grid infrastructure faces severe strain. Eastern European nations like Latvia, despite having very high solar penetration rates, grapple with aging grid infrastructure. The surge in solar generation pushes system capacity to the limit; power that cannot be integrated into the grid goes to waste, causing the risk of solar curtailment to skyrocket. Grid integration bottlenecks have emerged as the primary obstacle in the next phase of Europe's renewable energy transition.
IV. Commercial Growth: Where Are the New Opportunities in the "Second Half" of the PV Era?
As PV penetration surpasses 20%, grid integration bottlenecks have thrust the industry into a "second half" characterized by the restructuring of revenue models. For B2B decision-makers and investors, commercial opportunities are rapidly evolving in three key directions:
1. Explosive Demand for Utility-Scale and Residential BESS
Battery Energy Storage Systems (BESS) have emerged as the essential solution to challenges such as negative electricity prices and solar curtailment. The EU and its member states are accelerating policies mandating "Solar-plus-Storage" configurations and implementing capacity market subsidies, driving explosive growth in demand for both utility-scale and residential energy storage.
2. Virtual Power Plants (VPP) and AI-Driven Flexible Dispatch
In response to highly volatile spot electricity prices, AI-powered Virtual Power Plant (VPP) platforms are on the rise. Intelligent algorithms enable these systems to absorb low-cost or even negative-priced green electricity into storage during midday periods of negative pricing, and discharge it back to the grid during evening peak-price periods, thereby generating revenue through arbitrage and flexible frequency regulation.
3. Structural Transformation of Chinese PV/Storage Exports
Emerging markets—led by the Baltic states and Central and Eastern Europe—are rapidly shifting from merely purchasing modules to procuring "cost-effective energy storage systems and integrated solutions." Chinese energy storage companies capable of integrated delivery and localized O&M (operations and maintenance) are securing a core competitive advantage amidst this wave of growth opportunities.
European PV Phase II Commercial Opportunities Matrix (2026)
|
Opportunity Pillar |
Core Business Model & Value Proposition |
Target Key Markets |
Strategic Impact & Investment ROI |
|
BESS Integration |
Co-located Utility-scale & Commercial Storage to capture price spreads and reduce curtailment |
Germany, Italy, Baltic Region, Bulgaria |
Primary hedge against negative solar capture prices |
|
VPP & AI Dispatch |
Algorithmic trading across intraday & ancillary services markets via aggregated distributed assets |
UK, Germany, Netherlands |
Unlocks revenue stacking beyond simple self-consumption |
|
Systemic Export Push |
Transitioning from PV module supply to integrated, high-safety LFP BESS container solutions |
Latvia, Lithuania, Poland, Greece |
High-margin opportunity for Chinese clean-tech exporters |
V. Summary:
1. Key Insight
A lead analyst at the Fraunhofer Institute for Solar Energy Systems (Fraunhofer ISE) noted: "Surpassing the 20% threshold for three consecutive months validates the resilience of Europe's energy transition; however, grid flexibility and energy storage infrastructure must keep pace with the rate of PV installations to transform these short-term records into a stable, long-term supply of green electricity."
2. Future Outlook
As sunlight levels decline during the autumn and winter months, solar penetration rates will experience a seasonal pullback. A realistic assessment indicates that achieving the RePowerEU targets cannot rely on PV breakthroughs alone; instead, it requires systemic synergy across solar PV, energy storage, wind power, and cross-border grid infrastructure.
Saudi Arabia Places Major Bet on 1.07 GWh Solar-plus-Storage Deal to Resolve Syria's Grid Crisis
A New Growth Surge After Reaching 22.8 GW: Are the UK’s 800W Plug-in Solar Systems a Windfall or a Trap?
Related Article


contact us
For more questions please


Office Address: 701, Building A, Yonghuayuan Business Building, Baotian 2nd Road, Chentian Community, Xixiang Street, Bao'an District, Shenzhen, Guangdong Province, China
Factory Address 1: Room 701, Building 2, Kegu Industrial Park, Zone B, Jian'an Road, No. 790, Chang'an Town, Dongguan City, Guangdong Province, China
Factory Address 2: Building 7, Phase II Standardized Factory, Innovation Industrial Park, Duji Economic Development Zone, Huaibei City, Anhui Province, China